In their basic forms cadastral maps show outlines of land parcels as determined by surveys, and the parcels are usually named or numbered to match legal property and taxation records. These maps often ignore topographical features except where they are important for identifying property lines. They also show restrictions and easements on rights to land, and more elaborate cadastral maps may include buildings and property, information on taxes and property values, and sometimes the names of owners. Most cadastral maps only hint at land use, and getting at this information requires comparing cadastral lists with material such as census manuscripts, farm diaries and account books, and other more qualitative sources. In some respects, land use features were of little interest to the state except in aggregate form through censuses, and the documentation of cadastral maps was a mechanism for tracking property values and location. James Scott argued that cadastral maps were “designed to make the local situation legible to an outsider” (Scott, 45). The Island Imagined project connects researchers to an extensive collection of nineteenth century cadastral maps and plans. These descriptive records were meant to connect leases, deeds, purchase payments, and tax payments to individual properties and their occupants. In many cases the maps delineated property boundaries, although the earliest comprehensive cadastral boundary map is Meacham’s Illustrated Atlas, of 1880.
Meacham’s Illustrated Atlas is a key resource on Island Imagined, and it represents a range of possibilities for landscape and land use research with cadastral maps. Highly detailed atlases produced by J. H. Meacham and other publishers were designed to appeal to a mass market and were popular in other parts of Canada in this period. These atlases usually contained cadastral boundaries and directory listings for the occupants of many or all properties in rural areas and small towns. For other examples and for a digitized collection of historical atlases in Ontario see The Canadian County Atlas Digital Project.
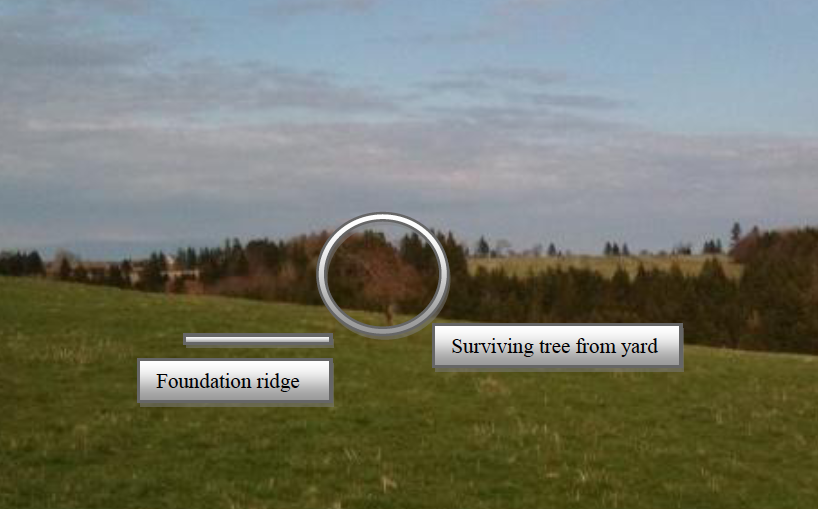
In this image of Lot Thirty One (Figure 2), we can follow the contours of the landscape from Clyde River up the Bannockburn Road and observe a natural and built environment significantly different from the one we see there today. Some landmarks are visible in the map that persist today such as the Atwell sandstone house on what was Zac Mayhew’s property (A) (Figure 3). Other dwellings such as the house on Archibald McFadyen’s 105 acre property (B) are now gone and marked only by an undulation in the landscape and a lone tree standing in what was once a farm yard (Figure 4).
This virtual walk up the Bannockburn reveals that a short span of the upper Clyde River was dammed in 1880 in at least four places to provide water power to half a dozen local mills. The final dam appeared near the Kingston crossroads where a busy concentration of store, mill, and church buildings once serviced the agricultural community in the surrounding areas (Figure 2: C). However, all the mills and dams are gone today. The Clyde River flows silted but otherwise unfettered into the brackish West River; the intersection in Kingston hosts only a small church, a community hall, and some homes retrofitted from stores and church buildings.
In another setting, comparing topographic features over time by using the Meacham’s and Cummins atlases can gives us a glimpse of human responses (and lack thereof) to coastal erosion. Given that its colloquial name is “the Acadian peninsula” it is not surprising that a large section of Lot Fifteen is exposed to erosion. One precarious spit at the mouth of the Haldimand River was recorded as land owned by the Angus McMillan Shipyard in 1880, but oddly enough, the 1927 atlas suggests that this parcel was not fit to be considered a property (Figure 5 and Figure 6).